# Debugging Scripts
Scripts that run within Universal run within background processes or runspaces which may make it hard to debug what is happening within a script. You can use cmdlets like Write-Debug and Write-Verbose to provide more information in logs for apps and jobs.
## Visual Studio Remote Debugger
Using the PowerShell [Universal Visual Studio Code Extension](https://docs.powershelluniversal.com/development/visual-studio-code-extension), you can connect directly to your PowerShell scripts running PowerShell Universal.
## Integrated Debugger
{% hint style="warning" %}
The integrated debugger is supported in PowerShell 7 and integrated environments. It is not supported in Windows PowerShell.
{% endhint %}
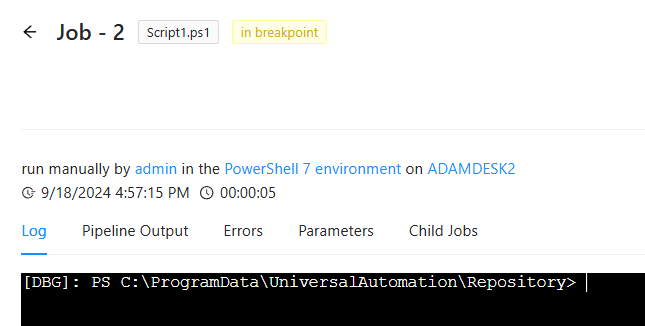
The integrated debugger allows for access to a debug console for running scripts. You can include the `Wait-Debugger` cmdlet call in your scripts and they will transition to an In Breakpoint state. Once this takes place, you can view the Job to run commands against the script.
### Scripts
PowerShell Universal integrates directly with the PowerShell debugger. You can include `Wait-Debugger` within your scripts to cause them to pause.
For example, assume you have a script with a `Wait-Debugger` call included. The first line will execute and then it will pause once it reaches the second line.
$Processes = Get-Process
Wait-Debugger
Once a script is paused, you will see a terminal for debugging the script.
Debugger Terminal
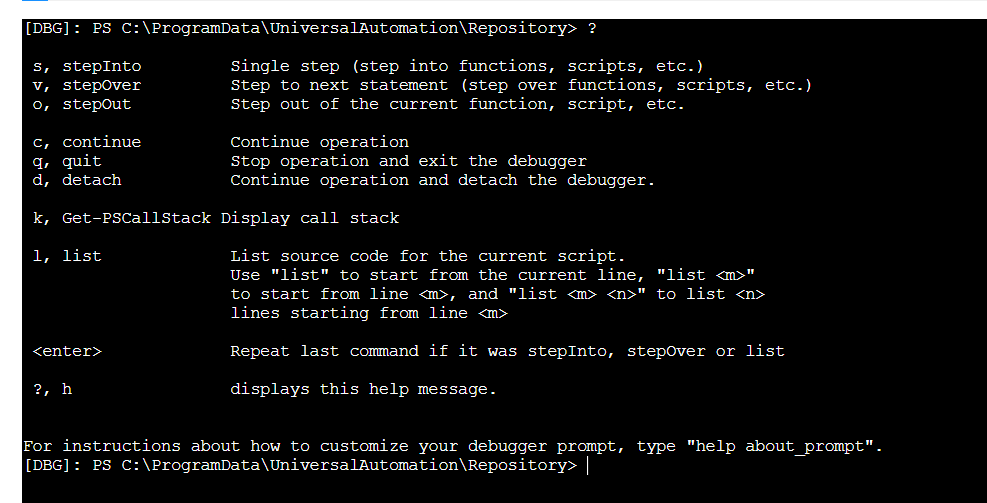
You can then use the built in debugging commands to step through the script.
Debugging Commands
### Apps
You can use `Wait-Debugger` directly in your PowerShell Universal Apps. You can include this command in event handlers and dynamics to pause the app execution and evaluate the current state of the script.
For example, you can include `Wait-Debugger` in a dynamic.
```powershell
New-UDApp -Title 'PowerShell Universal' -Content {
New-UDDynamic -Id 'dynamic' -Content {
Wait-Debugger
New-UDTypography "Loaded"
} -LoadingComponent {
New-UDSkeleton
}
}
```
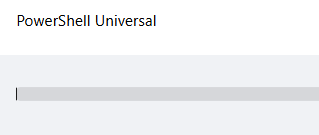
The result is the app will display the loading skeleton because the PowerShell debugger is in breakpoint.
Within the admin console, you can click the Debugger tab to view the current breakpoints that the app is waiting on. The debugger provides a terminal for evaluating commands against the runspace. You can use any standard PowerShell command. You can also use the debugging tools such as stepping and source code listing. There are buttons available at the top of the console.
You can use commands like `Get-Variable` to get information about variable state. Execute `c` to allow the endpoint to continue executing.
## Logging Scripts
Certain aspects of Universal will log their scripts automatically. Other features may require you log yourself.
### APIs
You can use the Live Log view on the Log tab to view logs for the selected API.
### Jobs
Jobs log extensively. You will see console and pipeline output. If you set`$DebugPreference` or `$VerbosePreference` , you will also see those streams in the console output. You can add additional log messages using `Write-Debug` or `Write-Verbose` .
### Apps
Apps log informational, warning and error messages to their log. It's recommended to use logging when starting an app rather than trying to attach a debugger. You can also use the `$DebugPreference` variable to get additional information during your app startup.
```powershell
$DebugPreference = 'Continue'
New-UDApp -Title 'Test' -Content {
Write-Debug "My app is loading. I have am $user with $roles"
New-UDTypography -Text 'Hello, world'
}
```
### Authentication and Authorization
You can use the Live Log view on the authentication and role pages to see PowerShell stream output.
## Debugging Scripts from a PowerShell Console
You can debug any script within Universal (or any PowerShell process, really) using the debugging cmdlets that are available in PowerShell. These cmdlets allow you to connect to local PowerShell processes, like Universal, and step through your scripts right in the terminal.
### Pausing the Script
First, you will need to ensure that the script will wait for you to connect the debugger before continuing. This means that you'll need to include a `Wait-Debugger` command somewhere in your script.
{% hint style="info" %}
Apps will only wait 10 seconds during startup so putting a Wait-Debugger in them may not work. You should rely on the use of $DebugPreference and Write-Debug to diagnosis app startup issues.
{% endhint %}
### Executing your script
Now that you have your script setup to pause and wait for the debugger, you will want to execute your script. For jobs, just start the job. For APIs, you will need to make a request to the API via the endpoint you are trying to test. For apps, you will want to load the page in your browser. For authentication and authorization, you will want to login.
### Finding your process ID
Once you have your `Wait-Debugger` command in the script that you want to debug, you'll need to start the script and determine the process it is running within.
#### Jobs
Jobs run in their own isolated process within Universal. All you will have to do is start the job and it will start the process and wait on your `Wait-Debugger` command. Once your job has started, you can use the `Get-UAJob` cmdlet to find that job's process ID.
#### APIs
APIs run in a single PowerShell process. It does not start a new process for each API call. You can locate the API process by finding the pwsh or PowerShell process with the command line that includes `StartApi`.
#### Apps
Apps run in their own isolated PowerShell process. The process ID is listed in the app table within the Admin Console.
#### Authentication and Authorization
Authentication and authorization scripts run within the Universal server. You can find the `Universal.Server.exe` process and attach to that.
**Integrated Environment**
Any feature running within the integrated environment will be running within the `Universal.Server.exe` process. You will need to attach to this process in order to debug them.
### Attaching to the Process and Debugging the Runspace
Once you have the process that you want to attach to, you can do so by using `Enter-PSHostProcess` . Simply specify the process ID that you found in the previous step.
```powershell
Enter-PSHostProcess -id 1231
```
{% hint style="info" %}
Enter-PSHostProcess uses named pipes and requires that you have permission to the process that you are accessing. If you are running Universal as a service you may need to run it as your local account to properly connect to the process.
{% endhint %}
Once you have attached to the process, you will now want to find the runspace where your code is running. To do so, you can use the `Get-Runspace` cmdlet. This will return a list of runspaces currently active in your process. Look for the runspace marked `InBreakpoint`. This is the runspace waiting on the `Wait-Debugger` command.
Now that you found your runspace, use `Debug-Runspace` to attached to the runspace. You will now have the opportunity to issue debugging commands against that runspace. You can view the status of variables, issue commands and even step through the script.
For a full list of debugging commands, you can see the [Microsoft documentation here](https://docs.microsoft.com/en-us/powershell/module/microsoft.powershell.core/about/about_debuggers?view=powershell-7#starting-and-stopping-the-debugger).
### Example of Connecting to API Process
The following is an example of how to connect to an API process.
```powershell
$Process = Get-Process pwsh | Where-Object { $_.CommandLine.Contains('StartApi') }
Enter-PSHostProcess -Id $Process.Id
Get-Runspace
Debug-Runspace -Id 2
```
## Debugging with Visual Studio Code
To debug a script, you can use the Wait-Debugger cmdlet within your script to pause the script until a debugger is attached. You can then use a debugger, like VS Code, to attach to the process and runspace to view variables, step through code and execute debugging commands.
You can also debug scripts using the built in `Enter-PSHostProcess`, `Get-Runspace` and `Debug-Runspace` cmdlets.